How to Conduct Waste Analysis in Restaurants: A Category-Based Loss Guide
Waste analysis in restaurants is not just counting the products that go in the trash; it is making visible in which category, in which process, and for what reason profit is quietly eroding. Many businesses look at the total cost but lump different types of waste under the same heading: trim loss during vegetable preparation, products left over after open-buffet service, increased plate returns due to wrong portioning, or stocks approaching their expiration date that go unused. Yet a category-based view enables intervention at the right point instead of generalizing the problem.
Especially in kitchens with many products, waste is not a single problem. A disruption in any link of the purchasing, storage, preparation, production, service, and sales-forecasting chain can create a loss. For this reason, an effective analysis should ask "in which category, and why?" before asking "how much waste is there?" When such a framework is established, it becomes possible to make clearer decisions in many areas, from menu planning to order management, and from recipe standards to stock tracking.
Track waste not as a single line item but on a category basis
Knowing the total waste rate is useful as a starting point; but the real insight emerges when you break the loss down into product and process categories. For example, the cause and solution of a loss in the red-meat group is not the same as a loss in the leafy-greens group. While off-recipe use, wrong portioning, or a thawing error stand out for meat, storage conditions, holding time after washing, or low turnover may be more decisive for greens.
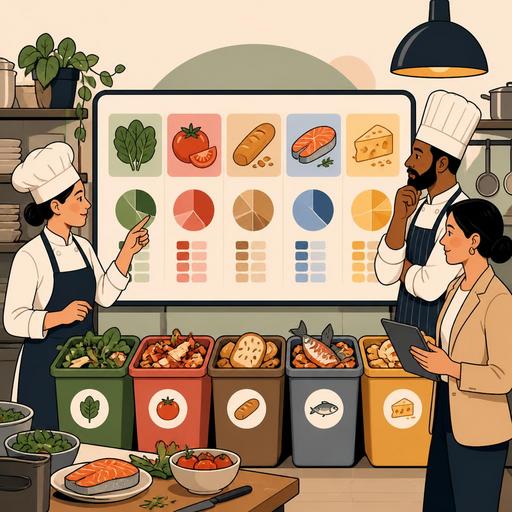
In practice, tracking waste in the following main categories makes your job easier:
- Preparation waste: losses occurring during trimming, peeling, trim, bones, peels, and cleaning
- Production waste: overcooking, burning, off-recipe application, faulty production
- Service waste: open-buffet leftovers, wrong orders, cancelled plates, customer returns
- Stock waste: spoilage, passing the expiration date, improper storage conditions
- Portion waste: non-standard gram weight, over-serving, uncontrolled complimentary items
This distinction allows you to manage each loss with the same discipline. For example, if you see high waste in fried items, the problem may not be the product itself; poor oil management, more pre-preparation than necessary during low-demand hours, or an unclear portion standard can also be factors. Similarly, high cheese waste during breakfast service may be related less to supply quality and more to the way it is displayed and the frequency of replenishment.
A field-applicable method for category-based waste analysis
The analysis must be built within the real flow of the kitchen, not at a desk. The most efficient approach is to first select a limited number of categories and collect data regularly over a few weeks. Instead of trying to track all products at once, it is more realistic to start with high-cost groups or those with critical turnover.
- Identify the critical product groups: meat, chicken, fish, dairy products, greens, fried items, sauce bases, and so on.
- Define a standard for each category: the purchasing unit, the cleaned net product, the target portion, and the expected preparation loss.
- Code the waste reasons: spoilage, faulty production, over-preparation, customer return, staff error, supply problem, and the like.
- Establish a daily recording routine: a short, standard record at the end of the shift is more valuable than irregular notes.
- Read it together with sales data: look not only at what went in the trash, but at what was sold and at which hours demand arose.
Consider a concrete example: at a burger restaurant, bread and lettuce waste increases on certain days of the week. At first glance, this might seem like a supply or quality problem. However, when sales hours are compared with preparation times, it may be seen that too much mise en place was done in the early hours for the lunch rush. The solution may not be a change in purchasing; it may be to shrink the preparation batches, update the demand forecast at an hourly level, and limit the holding time of open product.
In another example, at an à la carte restaurant, grilled salmon orders come in irregularly and stock spoilage occurs on certain days. The problem here is not just excess stock. If product visibility on the menu is low, if server guidance is inadequate, or if alternative products in the same price band are preferred more often, the waste is actually connected to menu performance. For this reason, waste analysis must be read together with menu engineering.
Connect the causes of waste to the real sources in the operation
Keeping a waste record is not enough on its own; what matters is finding the root cause that produces the loss. In many businesses, "staff error" is used as an easy explanation. Yet the problem is often incomplete process design. If there is no standard recipe, if the product-preparation list is not planned according to the shift, or if the sales forecast is not based on past data, the staff merely make the system's gap visible.
The following headings offer a good checklist for root-cause analysis:
- Purchasing mismatch: a box larger than needed, the wrong gram weight, a short shelf life
- Storage error: a break in the cold chain, wrong shelf placement, FIFO not applied
- Preparation-plan problem: production based on habit rather than demand
- Lack of recipe standard: the same product coming out differently from shift to shift
- Menu-driven imbalance: slow-selling products that require high stock
- Communication problem: wrong orders between the dining room and the kitchen, late cancellations, missing information
For example, if dairy-based product waste is high at a café serving coffee and desserts, this is not just spoilage. How much of which drinks were sold during the day, at which hours density occurred, which sizes of drinks used more milk, and how well the barista standard was maintained should be examined together. Otherwise, simply ordering less as a solution may also narrow the sales opportunity.
Digital tracking makes waste visible and manageable
Scattered records kept on paper often leave waste at the level of a "felt problem." Yet when a digital infrastructure is used, category-based losses can be read together with sales, stock, recipe, and shift data. This way, not only the total loss but also which product group the loss concentrates in, on which days it recurs, and which menu items it relates to becomes clearer.
What matters here is not using technology, but relating the same data to different operational layers. For example, tracking the featured products on the digital menu together with the semi-finished products prepared most in the kitchen can strengthen demand forecasting. When the sales flow coming through order management and POS integration shows which products gain momentum at which hours, the preparation amount can be planned more accurately. On the menu-management side, noticing slow-moving products also reduces stock risk.
For restaurants, the real value lies not in keeping waste data in isolation but in its ability to talk to the rest of the operation. When such a structure is built, the following questions are answered more quickly: Which category produces regular loss? In which shift do deviations increase? Which menu item creates a forecasting error? Which product ties up more stock than its sales volume warrants?
A clear action plan to apply in the first 30 days
You do not need to wait for a big transformation to reduce waste. Small but disciplined steps produce visible results in a short time. The first 30 days in particular are critical for clarifying the current situation.
- First week: Select the 5 highest-cost product groups and clarify the waste-reason codes.
- Second week: Make recipe, portion, and preparation standards visible on a per-shift basis.
- Third week: Compare sales hours with the preparation amount; flag the points where over-preparation is done.
- Fourth week: Re-evaluate slow-moving menu items together with the products that create stock risk.
At the end of this process, the goal is not to produce a flawless spreadsheet but to catch recurring loss patterns. For one business, the problem may be the open-buffet replenishment frequency; for another, off-recipe portioning or low-turnover products taking up more space than necessary on the menu. Thanks to the category-based approach, the solution becomes targeted rather than general.
In conclusion, waste analysis in restaurants is, beyond cost control, a management reflex. When you break losses down by product group, process, and cause, kitchen performance becomes more readable; purchasing is done more deliberately, the preparation plan moves closer to real demand, and menu decisions rest on data. Carrying this visibility into the daily flow of operations with digital tools like Restomas makes it easier not only to detect waste but to reduce it regularly.
If you want to manage waste with data rather than guesswork, you can take a look at Restomas's digital structure that makes restaurant operations visible.